Admin Dashboard
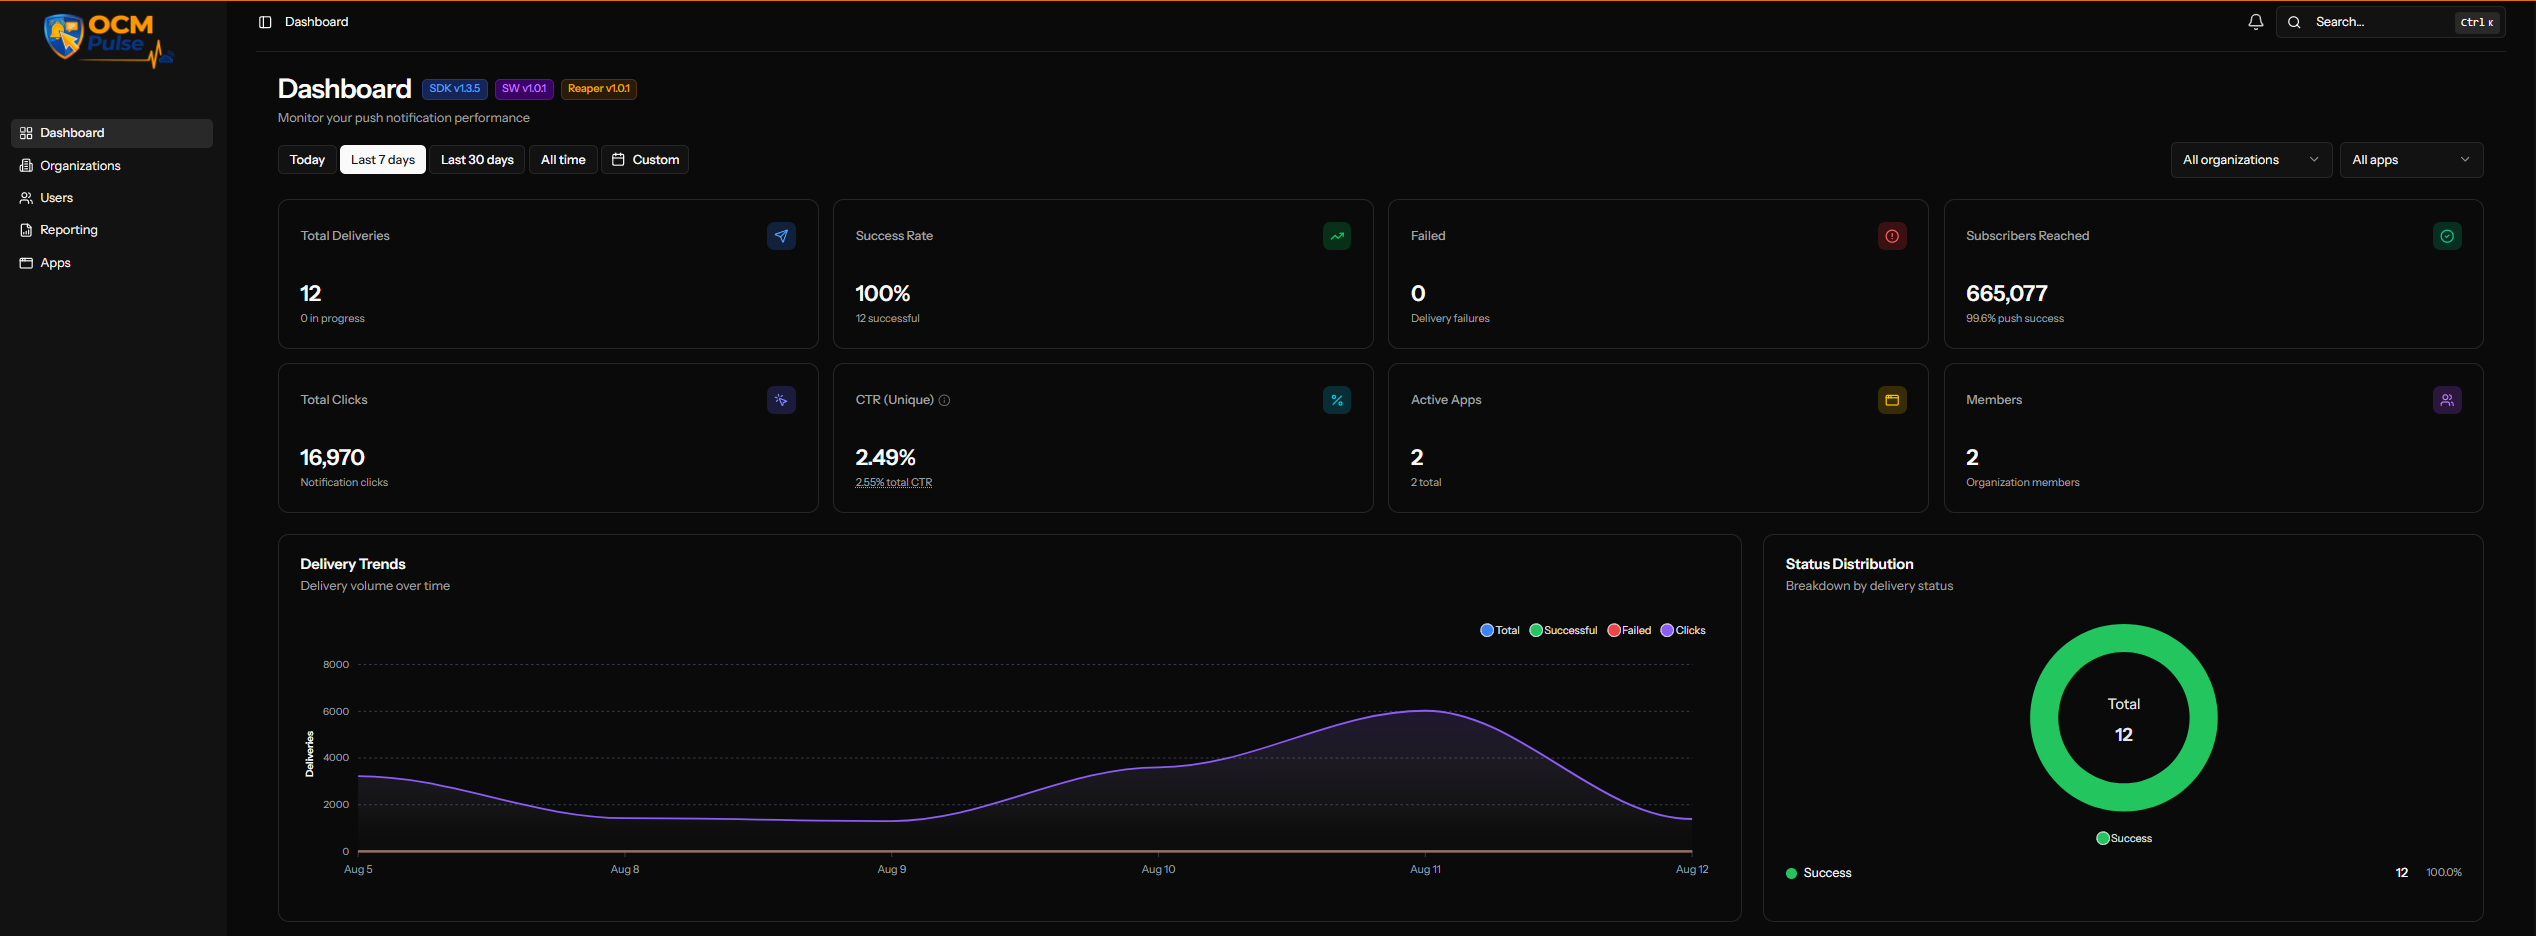
The Admin Dashboard gives you a cross-app view of push notification performance — delivery volume, success rates, subscriber growth, click analytics, and per-app unsubscribe health — in one place.
This page is scoped to your organization. If you belong to more than one organization or have broader access, an organization filter lets you switch between them or view all at once.
Accessing the Admin Dashboard
Click Dashboard under Admin in the sidebar. Unlike most other pages in OCM Pulse, this one is not scoped to a single app — it aggregates across every app you have access to.
The header shows your current platform versions: SDK, SW (Service Worker), and Reaper version badges.
Filters
| Filter | Options |
|---|---|
| Date range | Today, Last 7 days, Last 30 days, All time, Custom |
| Organization | All organizations, or a specific one |
| App | All apps, or a specific one |
Summary Tiles
| Tile | Shows |
|---|---|
| Total Deliveries | Count in range, plus how many are still in progress |
| Success Rate | Percentage, plus the successful count |
| Failed | Delivery failure count |
| Subscribers Reached | Total reached, plus overall push success percentage |
| Total Clicks | Notification click count |
| CTR (Unique) | Unique click-through rate, with a tooltip showing total CTR separately |
| Active Apps | Apps with activity in range, plus total app count |
| Members | Organization member count |
Unsubscribe Diagnostics
An expandable panel ("Show calculations" / "Hide") showing the current-week unsubscribe calculations for every app in the current view — an early-warning system for apps whose unsubscribe rate is spiking.
For each app, you'll see:
- A status tag: Low Activity (fewer than 3 unsubscribe events this week — alert suppressed), Retention Too Short (the app's inactive-subscriber cleanup is too aggressive to produce a reliable 4-week baseline), Low Audience, or no tag if the app is being evaluated normally
- This Week Rate, Baseline Avg (4-week average), and This Week Unsubscribes
- A week-by-week table: Week / Range / Active at start / Unsubscribes, covering this week plus the prior 4 weeks
- Threshold (calculated as 2× the 4-week baseline average), Baseline avg (4 wks), and Active subscribers now
An app is flagged when its current-week unsubscribe rate exceeds its own threshold — this is a per-app, self-relative comparison, not a fixed platform-wide number.
Notification Fatigue
A table of subscribers currently capped by frequency limits, per app: App / Capped / Cool-down, each with a count and percentage. Only apps with frequency capping enabled and at least one capped subscriber appear here.
Delivery Trends
A line chart plotting Total, Successful, Failed, and Clicks over the selected date range — the fastest way to spot a sudden drop in delivery volume or a spike in failures across your apps.
Status Distribution
A donut chart showing the breakdown of deliveries by status (Success, Failed, Partial, etc.) for the selected range, with the total count in the center.
Top Apps by Volume
A table ranking apps by delivery count: App / Deliveries / Success Rate / CTR / Subscribers. Useful for quickly identifying your highest-volume apps or spotting one with an unusually low success rate relative to its volume.
Recent Activity
A live feed of the most recent deliveries across all apps in view: Title / App / Status / Clicks, with a relative timestamp ("about X ago").
Top Performing Content
A ranked list (top 5) of the highest click-through-rate deliveries in the last 30 days — this window appears to be fixed rather than tied to the page's date range selector. Each entry shows the title, source app, CTR percentage, and a relative progress bar for quick visual comparison.
Click Analytics
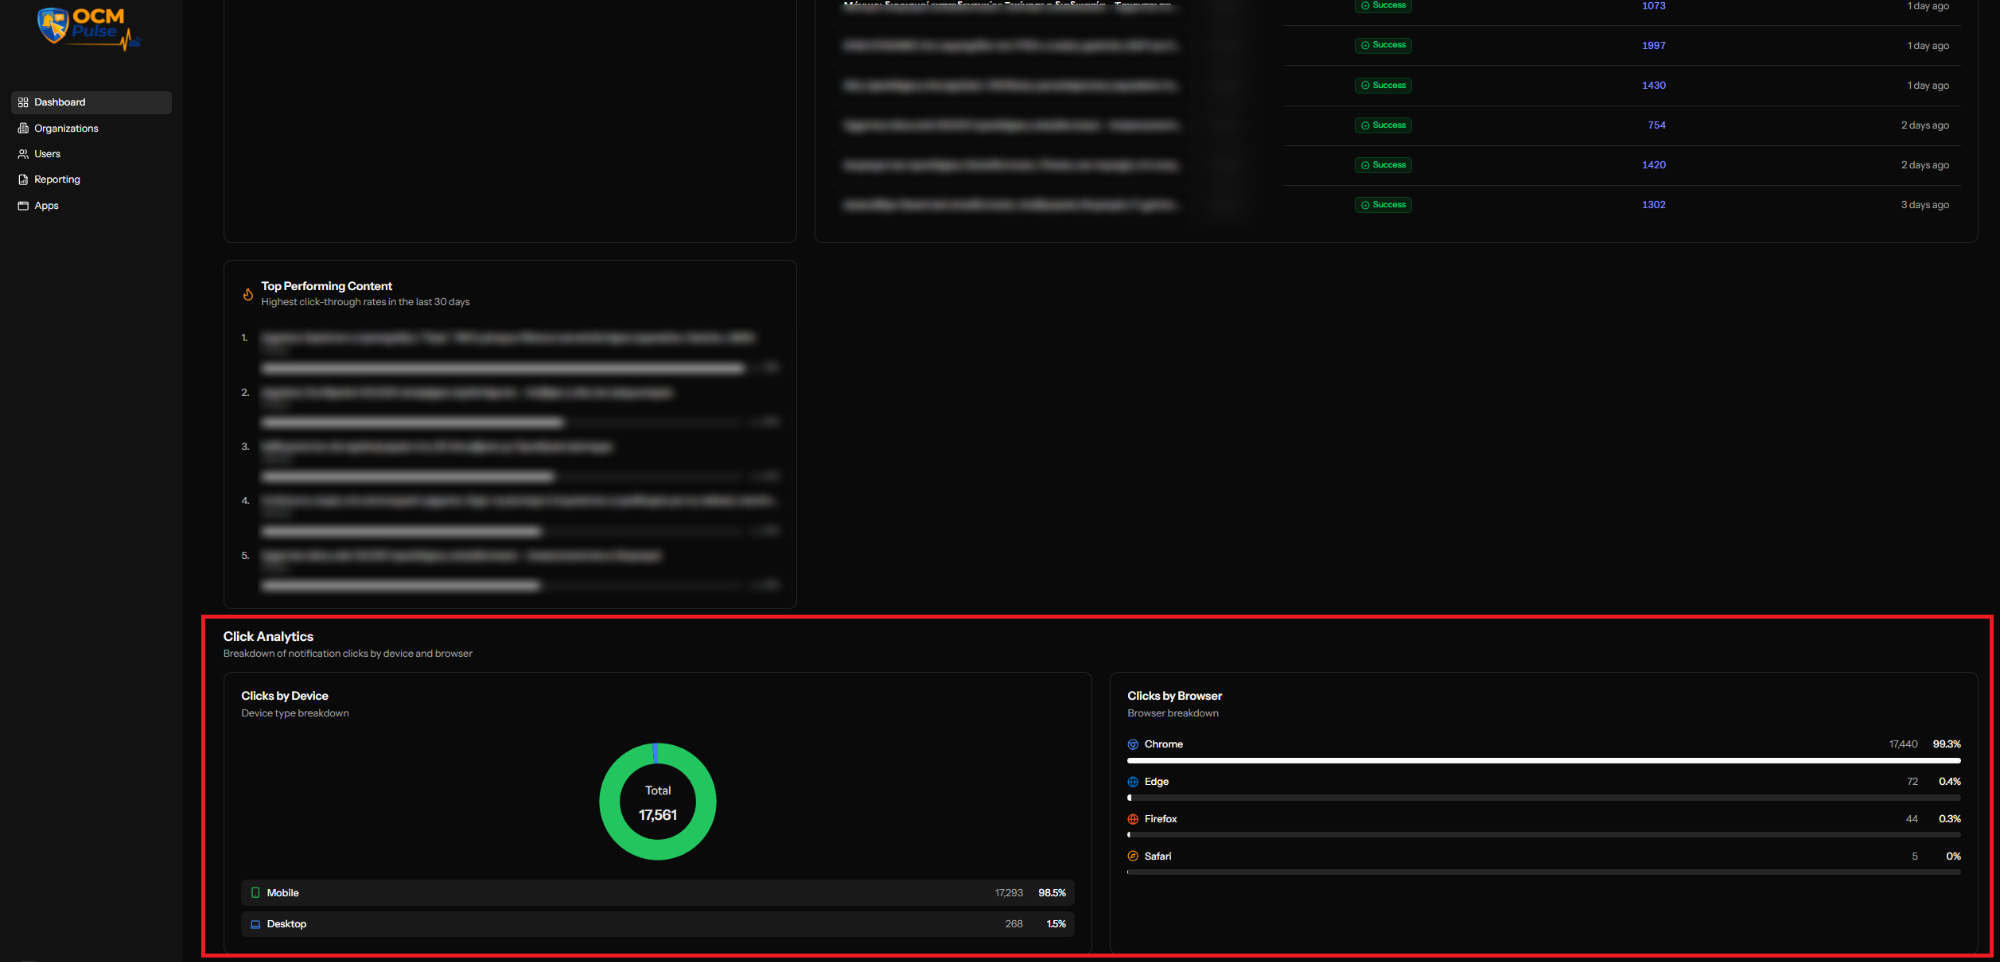
Two breakdowns of notification clicks in the selected range:
- Clicks by Device — a donut chart with total clicks and a Mobile/Desktop/Tablet split
- Clicks by Browser — a breakdown by Chrome, Firefox, Edge, Safari
A System Notifications element also exists on this page but wasn't confirmed to render visibly during this audit — it may only appear when there's an active system alert, or be gated behind a different permission level. If you see one on your dashboard, this section should be filled in with what it actually shows.
Next Steps
- View delivery details for a specific app
- Configure frequency capping if Notification Fatigue is showing high capped percentages
- Set up Reporting for scheduled, exportable versions of this data