Subscriber Growth
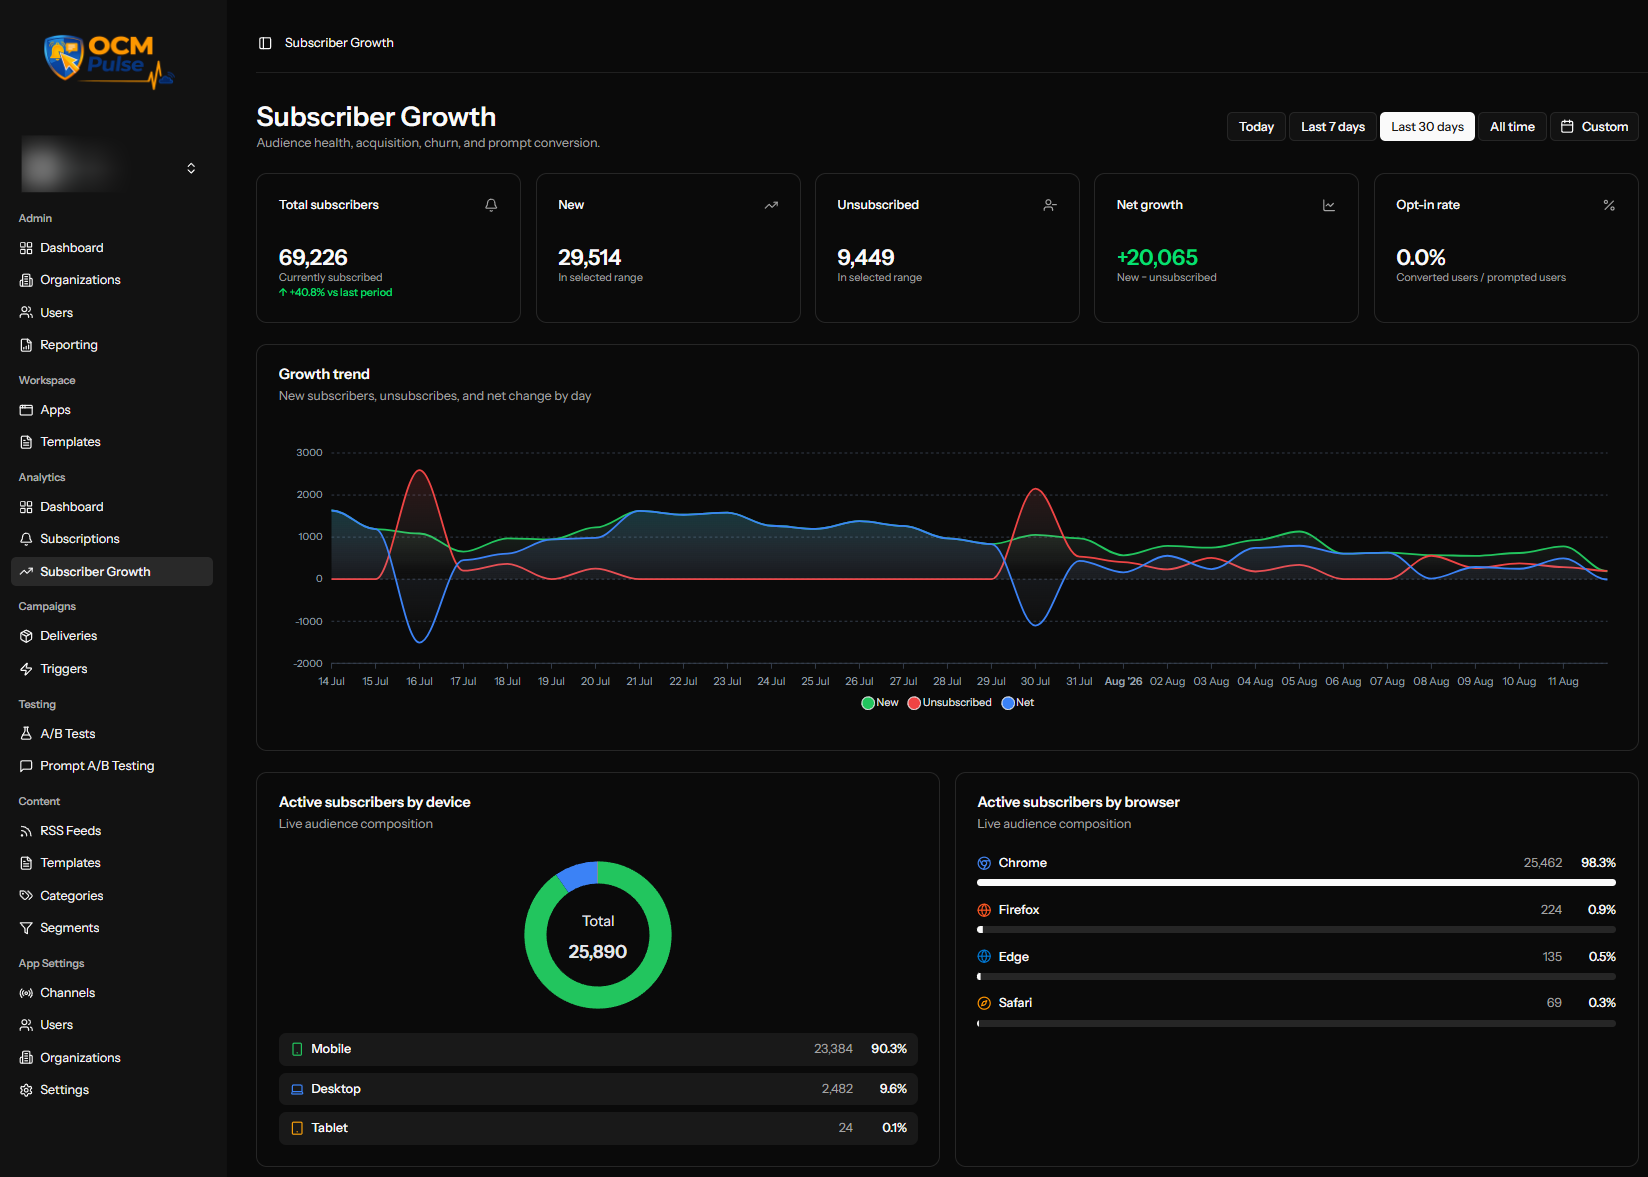
Subscriber Growth is the analytics dashboard for audience health, acquisition, churn, and prompt conversion — how your subscriber base changes over time, broken down by device, browser, and individual prompt.
Accessing Subscriber Growth
- Navigate to your app
- Click Subscriber Growth under Analytics in the app menu
This is distinct from the Subscriptions page — Subscriptions is the individual subscriber list and detail records; Subscriber Growth is the aggregated trend view.
Date Range
All metrics on this page respect a date range selector: Today, Last 7 days, Last 30 days, All time, or Custom.
Summary Metrics
| Metric | Description |
|---|---|
| Total subscribers | Currently subscribed, with a percentage change vs. the previous equivalent period |
| New | New subscribers in the selected range |
| Unsubscribed | Unsubscribes in the selected range |
| Net growth | New − Unsubscribed |
| Opt-in rate | Converted users / prompted users |
Growth Trend
A chart plotting New, Unsubscribed, and Net change by day, so you can see whether growth is accelerating, flat, or declining, and whether unsubscribe spikes correlate with anything you changed.
Active Subscribers by Device / by Browser
Two live audience-composition breakdowns:
- Active subscribers by device — Mobile / Desktop / Tablet, with count and percentage of total
- Active subscribers by browser — Chrome / Firefox / Edge / Safari, with count and percentage of total
Both reflect your currently active audience rather than a historical trend.
Opt-In Rate by Prompt
Unique converted users divided by unique users who saw the prompt, broken out per individual prompt (every prompt with at least one impression in the selected range). If you run more than one permission prompt — for example, testing a Slidedown against a Bell via Prompt A/B Testing — this is where you see which one is actually converting, rather than one blended number.
Impression Volume
Raw prompt render counts in the selected range, showing Total impressions and Unique prompted users, then a per-prompt table:
| Column | Description |
|---|---|
| Prompt | The prompt type |
| Impressions | Total times it was rendered |
| Users | Unique users who saw it |
| Renders / User | Impressions ÷ Users |
The Renders / User column surfaces reload amplification — a prompt with many more renders than unique users is firing on every page reload for the same people, rather than respecting dismissal or subscription state. A healthy prompt should sit close to 1.0; a much higher number is worth investigating with your development team, especially if it correlates with unusually high server load.
Next Steps
- View individual subscriber records
- Set up Prompt A/B Testing to compare opt-in rates directly
- Configure Permission Prompts